Were the San Francisco Giants #1?
Last month, I posted a review of a new book titled "Who's #1?" on the mathematics of ranking and rating - if you're interested, you can purchase a copy via the Amazon sidebar on the right. Today I'd like to study the San Francisco Giants with one of the techniques used in this book: the offense-defense rating method.
Why the Giants? It's really just a personal preference. For the non-Giants fan, though, it's worth pointing out that the Giants won the World Series in 2010, but failed to even make the playoffs in 2011. Let's try to investigate why this is the case. Baseball fans may have their own explanations for this observation, but for a moment let's focus on the math.

As the name suggests, the offense-defense rating method rates a team's offensive and defensive capabilities. Of course, these two things are highly interdependent - if a baseball team scores 10 runs in a game, for example, is it because they have a couple of excellent hitters, or is it because the team they played against is terrible at catching the ball? Usually the answer involves a little bit of both, and so trying to tease out offensive versus defensive achievement can be difficult.
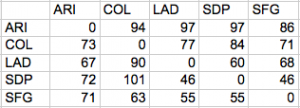
Let's pull together some numbers. I'll focus on the five teams in the National League West, since these are the teams the Giants play the most frequently. Along with the Giants, the NL West consists of the Arizona Diamondbacks, Colorado Rockies, Los Angeles Dodgers, and San Diego Padres. Consider the following array of runs scored by each possible pairing of these teams during the 2010 season:
The number in the ith row and the jth column gives the number of runs allowed by team i against team j; equivalently, it shows the number of runs scored by team j against team i. For example, in 2010 this shows that San Francisco scored 86 runs against Arizona, while Arizona scored 71 runs against San Francisco (this and all other baseball data is taken from here). Of course, one could easily argue that runs scored and runs allowed are not the best measures of a team's offense or defense; however, these numbers are easy to understand, so let's stick with them and see what the rating method tells us.
The goal is to use the above data to pull out some offensive and defensive ratings. We'd like for the offensive score we create to reward strong offensive performance against strong defensive teams; scoring 10 runs against a team with a great defense should mean more than scoring 10 runs against a team with a weak defense. We'd like a similar property for our defensive ratings: keeping a powerhouse team to a small number of runs should mean more than keeping a team with weak bats to a small number of runs.
The offense-defense rating method works by measuring, say, the Giants' offense as follows:
oSFG=dARI86+dCOL71+dLAD68+dSDP46,
where dARI denotes Arizona's defensive score, and similar notation holds for the other teams. The numerator in each term, as seen from the table, is simply the number of runs scored by the Giants against a particular team. This expression has the property that the better a team's defense, the more valuable the runs scored by the Giants against this defense, and vice versa for a team with a weak defense. Similar scores can be defined for the other teams - in any event, for offensive scores, bigger is better.
We can do the same thing for defense:
dSFG=oARI71+oCOL63+oLAD55+oSDP55.
Now the numerators represent runs allowed, and we want to keep this number small, rather than large. This means that preventing runs from a weak offensive team is more important than preventing runs from a strong offensive team. Similar measures can be defined for the other teams.
This seems a little bit circular - to compute the offensive scores we need to know the defensive scores, but to compute the defensive scores we need to know the offensive scores! One way to break this cycle is to start with an arbitrary collection of defensive scores: suppose, for example, that we initially set all the defensive scores equal to 1. We can then use these values to compute all the offensive scores, and then can use those offensive scores to refine the defensive scores. But once we have those refined defensive scores, we can play this game again! We can continue this process, refining our offensive and defensive measures until they are as precise as we'd like.
It's possible to do all of this calculation using matrices, but I'll leave that discussion in the textbook for folks who want to dig deeper. By way of example, though, here's a table of the first few offensive and defensive scores for San Francisco one obtains by successive refinement:

Successive refinements of the offense/defense measures for the 2010 Giants.
Remember, bigger scores are better for offense, while smaller scores are better for defense.
How do these scores compare to other teams in the 2010 NL West? If we compute these scores for each team, accurate to four digits, we obtain the following table of values:
| Team | Offense | Defense | Offense/Defense | Final W/L Ranking |
| Arizona | 309.0 | 1.303 | 237.2 | 5 |
| Colorado | 362.8 | 1.100 | 329.8 | 3 |
| Los Angeles | 266.0 | 0.9428 | 282.2 | 4 |
| San Diego | 282.8 | 0.8641 | 327.3 | 2 |
| San Francisco | 255.9 | 0.8047 | 318.0 | 1 |
The second column shows the offense scores, the third shows the defense scores. The fourth column shows the ratio of the two - as with the offense scores, larger ratios mean a stronger team. The last column shows the team's final ranking at the end of the season, based on win loss record. The first place team, of course, advances to the playoffs.
What can we learn from this data? In 2010 the Giants had the best defense in their division by this measure, but the worst offense. In the ratio, which compiles both of these effects, we see that the Giants were right in the middle - better than the Dodgers and the Diamondbacks, but worse than San Diego and Colorado. So how did the Giants end up winning the division (and eventually the World Series)? It turns out that the Giants benefited from late season collapses from both San Diego and Colorado - Colorado, in particular, only won one of its final fourteen games. Having said that, winning the division was not easy for the team. In fact, they did not ensure their playoff berth until the very last day of the regular season, with a win over the Padres.
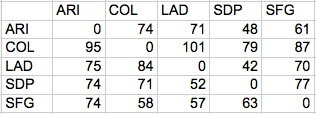
What happens if we compile the same data for the 2011 season? The initial run data for last year looks like this:
The corresponding offense/defenses ratings are computed in the following table:
| Team | Offense | Defense | Offense/Defense | Final W/L Ranking |
| Arizona | 313.8 | .9205 | 340.9 | 1 |
| Colorado | 311.1 | 1.322 | 235.3 | 4 |
| Los Angeles | 272.7 | 0.9357 | 291.4 | 3 |
| San Diego | 226.0 | 0.9197 | 245.8 | 5 |
| San Francisco | 290.6 | 0.9100 | 319.4 | 2 |
Last season, the Giants still reigned as defensive champions in their league. But they also improved offensively, moving from the words to the third ranked, ahead of the Dodgers and the Padres. In the ratio, the Giants were second place behind Arizona, matching the actual ranking determined by win/loss records. So even during an injury-plagued season, the Giants managed to move up in their overall offense/defense rankings, from third place in 2010 to second place in 2011. The only thing that kept them from making the playoffs last year was an epic collapse by Arizona.
Though the World Series champions in 2010 failed to even make the playoffs in 2011, according to the offense-defense rating method, the Giants actually improved their performance last year compared to the year before, moving from third place to second. Of course, this analysis only accounts for games the Giants played against other teams in their division, so it's quite possible that overall they did not do as well. I've restricted to the division games to keep the data set relatively small.
It's also worth noting that this analysis does not take into account specific features of each team's ball park; for example, Colorado plays at a high altitude, making the balls fly farther and possibly inflating the team's offensive measure, while deflating its defensive measure (research on this effect has been done, see here for example). Ballpark features can be folded into the model, but I will leave all further refinements in the hands of my capable readers!
If you enjoyed this analysis, there's much more of it in Who's #1, though the authors seem less interested in baseball than in other sports, football and basketball specifically. Sadly, the Giants do not feature prominently in their book either. I hope, however, that the Giants can continue to build on their offensive performance - if combined with a Dodgers collapse, the team has a good chance of returning to the playoffs once again this fall.
Psst ... did you know I have a brand new website full of interactive stories? You can check it out here!


