Are the 49ers skilled, or just lucky? Part 2.
In my previous post, I asked whether the San Francisco 49ers' improbably successful season was due more to luck (say, by being granted a relatively easy schedule), or due to real improvements in the skill of the team. By comparing the 2011 season with the 2010 season and correcting the schedule for the number of wins and losses each team accrued, I concluded that the level of difficulty of the team's schedule year over year was roughly the same, and therefore more of their success should be attributed to skill rather than luck.
In this follow-up, I'd like to dig a little deeper into measurements of the 49ers' skill, in an attempt to further bolster the above claim. If you are a football fan, then you are fortunate to have me write two football-themed posts in a row. If you are not a football fan, fear not; with the season having come to a close (I begrudgingly offer my congratulations to the New York Giants), I will move on to new topics after this.
There are a number of ways one could try to measure the skill of a football team, but I'd like to highlight one family statistics in particular - the proprietary PossesionPoints statistics. These statistics come in three flavors: offensive effect, defensive effect, and net effect.
Offensive effect is the most important. Each time the offense has the ball, they have an opportunity to earn offensive PossessionPoints - this number is a measure of the offense's success, and takes into account obvious factors (such as the number of points scored on the drive) as well as less obvious factors (length of time the offense had the ball, for example, as well as the amount of time left in the game). This number can only increase as the game goes on, and is a good predictor of a team's success - as stated on the PossessionPoints website (see here), when a team's offensive score is larger than 100, that team wins roughly 75% of the time.
Defensive effect is easy to understand given an understanding of offensive effect. More specifically, a team's defensive effect is equal to the opposing team's offensive effect. Since high offensive scores are a good indicator of a winning team, this means low defensive scores are also a good indicator, since a low defensive score means the opponent's offensive score is low. And indeed, defensive scores are also a good indicator of success - when a team's defensive score is smaller than 60, that team wins roughly 85% of the time.
But just as the best teams combine a strong offense with a strong defense, the best predictor of a team's success is the net effect, defined to be the difference between the offensive effect and the defensive effect. When a team's net score is greater than 40, that team wins over 90% of the time. Here's a video from 2008 summarizing this information, along with some examples.
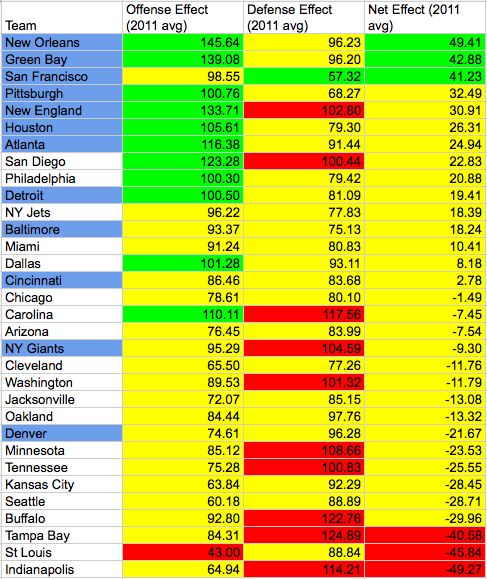
Using these statistics, we can compare the talent of teams in a given season by looking at their average offensive, defensive, and net PossessionPoints scores. Here's a table of those averages for the 2011 season, ranked in descending order by net score:

Table 1. Thanks to PossessionPoints for permission to reprint this data! Teams in blue made it to the playoffs.
The color coding gives an immediate indication as to the significance of the score - green is good, yellow is average, red is not so great. Ranked by net effect, note that the 49ers placed 3rd for the season. In particular, they were the only team in this season or the previous season with an average defense effect less than 60. On the offensive side, while their average offensive effect didn't quite make it into the green (98.55), it's good enough for 12th place among all NFL teams, above even the eventual Super Bowl champions.
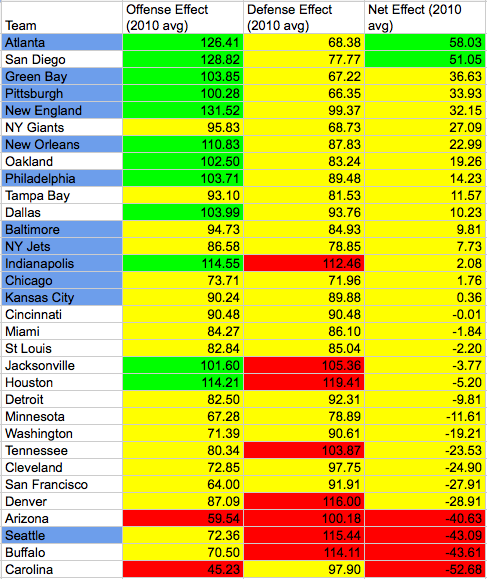
Compared to the previous season, these statistics are even more impressive. Here's a table with data from 2010:

Table 2. Thanks to PossessionPoints for permission to reprint this data! Teams in blue made it to the playoffs.
Offensively and defensively, the 49ers were fairly unremarkable in the 2010 season. Their offensive improvement from 64.00 to 98.55, combined with their defensive improvement from 91.91 to 57.32, gave them a net effect improvement of 69.14, by far the best improvement of any NFL team between these two seasons (the runner up is Carolina, whose net effect improved by 45.23). The offensive improvement was 4th best in the league by this measure, (behind Carolina, Green Bay, and New Orleans), while their defensive improvement was second only to Houston's.
Based on their 2010 numbers alone, it would have been very difficult to predict such a surprising degree of positive change for the 49ers. In fact, the good folks at PossessionPoints make these types of predictions at the beginning of every season. Ed Cavanagh, co-founder of the PossessionPoints website, shared the following observation with me via e-mail:
[I]n our "Preseason Preview" we make judgments about how much we think a team's offense or defense will improve or fall off in percentage terms and crank through and project their season record... Since there is judgement we also do an optimistic and pessimistic projection. You had mentioned the 49ers, in 2010 their offensive PossessionPoints number was 64 and defensive number was 91.91. In 2011 their offensive number was 98.55 (higher is better so that was a 54% improvement), their defensive number was 57.32 (lower is better so that was a 37% improvement). We had forecast just a 10% improvement in both so we didn't expect the season they ended up with. When we go back to our preseason data and put in the 54% and 37% adjustments their record projection would have been 15-1, much closer to their actual 13-3 record than our preseason prediction.
So even though the 49ers came up short this season, fans should be proud of the major improvements the team made, and they have much to be hopeful for once the 2012 season begins. While fans will undoubtedly debate what tweaks are needed to further increase the odds of a championship in 2013, I'm of the strong opinion that a 21st century 49ers music video couldn't hurt.
One final note: it may seem surprising that the New York Giants won the Super Bowl this season, given the lackluster stats cited in Table 1 above. But once the Giants made it to the playoffs, their stats vastly improved. Over four playoff games, their average offense effect was 111.03, and their average defense effect was an impressive 50.12, resulting in an average net effect that surged to 60.91. Given these numbers, their road to victory is much less surprising.
(Thanks again to PossessionPoints, and Ed Cavanagh in particular, for permission to use this data and for other helpful comments).
Psst ... did you know I have a brand new website full of interactive stories? You can check it out here!
comments powered by Disqus
